Indian Market- statistical valuation part 2
Indian Market : Statistical Valuation
I wrote about statistical valuation on Sep 2018 ( http://tiny.cc/jk0paz). This is the updated version of the same.
When I had written about statistical valuation, Small Cap and Mid Cap index level was 15239 and 15341 respectively. Presently, Small Cap and Mid Cap index closed 12,496.35 and 13,546.92 respectively, fallen 17% and 11% from 26th Sep 2018.
Now Revisiting my updated analysis:
1. Bull or Bear Power: I've calculated the difference between no. of stocks more than 12 month moving avg vis a vis no. of stocks less than 12 month moving average.
x

The present fall is similar to 1997 as reflected in the above chart. As on 31st July, 15% BSE Listed stocks are above 12 months moving average while 85% BSE listed stocks are below 12 month moving average. The market power ( % of stocks above 12 month moving avg - % of stocks below 12 month moving avg) i.e. Bull or Bear decided based on this positive or negative no..
Presently this is -70% so Bear has complete power in their favor. This figure was 51% in June 2019. Historically, Market made bottom when the difference is between -72% to -76% except 2008 when this figure was -% 94.
Based on the above chart, we are still some time away from previous bottoms ( range has been -72% to -76%).
2. Index Comparison: In order for a trend to be established Dow postulated, indices or market averages must confirm each other. Dow used the two US indices, the Dow Jones Industrial Average (DJIA) and the Dow Jones Transportation Average (DJTA), using the same analogy; I consider the Nifty vis a vis Mid cap , small Cap and other indices. There is clear divergence between nifty and other indices since Jan 2018.
The Dow Theory stated benchmark indices must confirm to each other when forming new highs or lows, although they don’t necessarily have to move in a lock step fashion. As far as our market is concern except nifty other indices are moving in opposite direction which reflect clear divergence. So later or sooner Nifty vis a vis other indices should move in same direction.
The below chart is prepared based on same analogy. I had posted index comparison in my 26th Sep 2018 post. The latest position is as under:

Historical data suggest Small Cap reaches in bubble zone when price ration of small cap vis a vis nifty goes below 0.60. The above chart shows that historically whenever it had reached to that level, correct is imminent. History is repeating it again, we had gone below 0.60 in Jan 2018 and since then correction had started in small and Mid cap segment.
Generally panic bottom made by market when small cap index ratio moves to 1 to 1.1x of Nifty. So whether we are moving towards that level.
The above theory is based on common sense psychology.
Markets moves in positive direction when there is buoyancy in the market, positive sentiments, liquidity, earning growth and positive news flow. During that time, investors specially retail investors tends to attract towards small and tiny cap to make quick money hence this lead to surge in demand of small and tiny cap stocks which resultant in increase in price hence small cap & mid cap stocks outperform to large cap and move to another extreme of pendulum i.e. euphoric or bubble zone.
Market move in negative direction when there is liquidity crunch, earning degrowth and negative news flow and negative environment. During this period, Investors moves towards safety, liquidate & throw the small and tiny cap holding which create huge supply and erosion in prices of stocks. This is the reason when small cap start moving towards another extreme stream of pendulum i.e. fear and panic zone.
As per the latest chart, small cap index is in fear zone and moving towards panic zone that may provide golden opportunity to investors. The above chart may also be useful for Mutual Fund investors to know when to move small or mid cap or large cap funds.
3. Fundamental Matrix: I had covered this it in my sep. post ( http://tiny.cc/jk0paz). We all know about Benjamin Graham's famous book intelligent investor. In
his book, he defined one multiplier which is known as graham multiplier
(EPBV). This ratio is defined as
the PE Ratio multiplied by the Price to Book Ratio.
While Graham preferred defensive investors to look
for companies having a PE Ratio of less
than 20 and a P/B ratio of less than 1.5, the P/B component is often too restrictive. The multiplier he used as 22.5 multiple of PE and P/BV.
than 20 and a P/B ratio of less than 1.5, the P/B component is often too restrictive. The multiplier he used as 22.5 multiple of PE and P/BV.
I have taken his logic and draw the same on NSE 500
Indices (represent 93% of list market capitalization.)

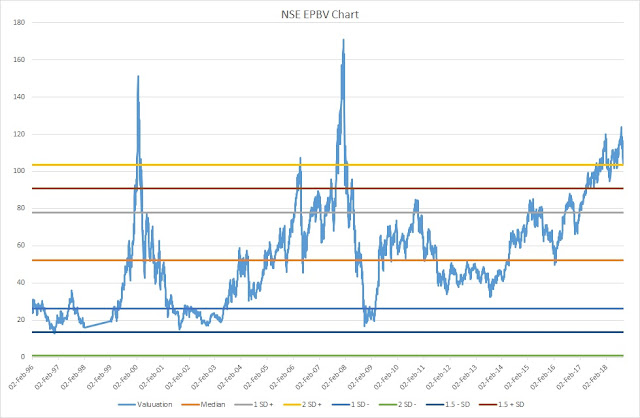
Generally, it is considered that bubble is
formed when the asset prices crosses 2 SD. So graham
multiplier median is around 52 for Indian market and 2 SD is 103 and
historically whenever, it has touched the 2 SD, there has been decent correction.
It has crossed 2 SD four times in past 22 years. All 3 occasion, it has
corrected and minimum correction was 31% ( May 2006 - June 2006). We
have again reached to 2 SD level in December 2017 and correction has started in small and Mid cap indices and now NSE 500 has also started decline and may be moving towards 1 SD. BSE small and mid cap is in correction mode since
Jan 2018 and corrected around 40 %and 25-30% respectively.
NSE 500 Dividend Yield Chart

NSE 500 PBV chart

NSE 500 PE chart

I am not sure if market will correct further
from here but above indicators helped me to do asset allocation between equity
and debt on right time. Greed has no end so one has to be cautious and careful in the market.
I am keenly watching:
1. Bull & Bear Chart and
2. index comparison chart
I believe we are moving towards another opportunity to built the long term portfolio. We have seen melt down and correction in Indian market in every 10 years. I believe our market is undergoing thought rough patch. Market is not going to end nor the companies. Successful business will survive. We need to capitalize the opportunities at right valuation. Such correction gives opportunities to buy quality at throw away valuation.
Disclaimer: I am not SEBI
registered analyst. All thoughts and views are strictly personal. I am
using it for my asset allocation decision. I am documenting my views for my personal purpose. It should not be considered for any buy or
sell recommendation. Please
do your diligence before investing.
If you can, plz share updated erosion of this very interesting analysis ..
ReplyDelete