Posts

Indian Market- statistical valuation part 2

Image
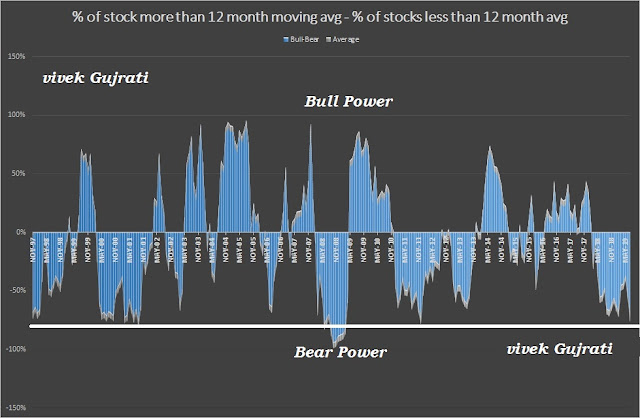
Indian Market : Statistical Valuation I wrote about statistical valuation on Sep 2018 ( http://tiny.cc/jk0paz). This is the updated version of the same. When I had written about statistical valuation, Small Cap and Mid Cap index level was 15239 and 15341 respectively. Presently, Small Cap and Mid Cap index closed  12,496.35 and  13,546.92 respectively, fallen 17% and 11% from 26th Sep 2018.  Now Revisiting my updated analysis: 1. Bull or Bear Power: I've calculated the difference between no. of stocks more than 12 month moving avg vis a vis no. of stocks less than 12 month moving average.  x    The present fall is similar to 1997 as reflected in the above chart. As on 31st July, 15% BSE Listed stocks are above 12 months moving average while 85% BSE listed stocks are below 12 month moving average. The market power ( % of stocks above 12 month moving avg - % of stocks below 12 month moving avg) i.e. Bull or Bear decided based on this positive or

Crisis has both risk and opportunity!!!

Risk and opportunity from Crisis or correction Those who has seen 2000 and 2008 meltdown knows what is crisis or correction. Prices start crashing in-front of  your screen and as an investor you are helpless...Just hoping and pray that market should recover.... Similar thing is happening presently. There are some pockets which are down 70-80% from their 2018 peak prices.  Whatever we call it, election fear, over valuation or bubble. The fact is  stock prices was not growing in tandem to earnings so market started correcting the mistake. Mood swing is very common phenomenon for Mr. Market. It move in both the extreme because market movement. Sometime extreme optimism and sometime extreme pessimism due to behaviour of human being as we are the only force which drive the prices. There are different kind of players in the market be it traders, investors, speculators, momentum chasers etc. and  correction affect everybody.  Everybody tries to get the maximum benefit from fal

Indian Market: Statistical Valuation

Image
Indian Market: Statistical Valuation Nifty has corrected around 6% from the top but stocks has corrected some 10-50%. There was clear divergence between Nifty performance vis a vis small cap and mid cap performance in last 7 months that itself was warning sign.  Small cap and mid cap has been correcting from quite sometime while nifty was moving upward. Again and again market give lesson that unless broader market is healthy, index can not move.  The present correction is happening because valuation of Indian equity (as per my understanding) reached to level where margin of safety is completely missing. Of course, there is always opportunity for stock picker in the market but when broader index correct, all the stocks feel the heat so impact the market all across. I am using some statistical tools ( it is not perfect) but helpful to understand overvaluation or undervaluation zone of the market and historically worked well so believe it will work in future as well fo

Corporate Governance

This is my first blog. I am very lazy in writing but now decided to share my thoughts and experiences which i accumulated as a student of finance over a period of last 13 years of my investment journey.  I think investing is all about trusting the manager who is running the business for you. it is his hard-work who ultimately rewards us as an investor through share price appreciation. There is no magic stick to understand the intend of incumbent manager. But there are ways which provide us a sense whether the management who are running are reliable or not or working for the benefit of shareholders. I am fond of identifying red flags in listed companies. If we rigorously follow all these red flags, it helps us to take informed decision about companies.   No business man is monk so finding clean and transparent company is very difficult. But understanding of red flags help us to draw a conclusion hoe much risk we are taking by investing in a company.  Corporate governan