Indian Market: Statistical Valuation
Indian Market: Statistical Valuation
Nifty has corrected around 6% from the top but stocks has corrected some 10-50%. There was clear divergence between Nifty performance vis a vis small cap and mid cap performance in last 7 months that itself was warning sign.
Small cap and mid cap has been correcting from quite sometime while nifty was moving upward. Again and again market give lesson that unless broader market is healthy, index can not move.
The present correction is happening because valuation of Indian equity (as per my understanding) reached to level where margin of safety is completely missing. Of course, there is always opportunity for stock picker in the market but when broader index correct, all the stocks feel the heat so impact the market all across.
I am using some statistical tools ( it is not perfect) but helpful to understand overvaluation or undervaluation zone of the market and historically worked well so believe it will work in future as well for zone of entry and exit. Correction always gives opportunity to add the stock and timely exit is also important otherwise all gain will be only on paper. Being a human being, our emotional quotient always supersede so i prefer to do it mechanically to control my emotions. Can be used for asset allocation ( shuffling between debt and equity) as well.
In last few days, crude is going upwards, rupees is depreciating rupees, trump and china trade war and now IL&FS default. Market need just a excuse to correct from overvaluation zone. I am putting some interesting charts which are prepared based on data available on public domain.
We all know about Benjamin Graham's famous book intelligent investor. In his book, he defined one multiplier which is known as graham multiplier (EPBV). This ratio is defined as the PE Ratio multiplied by the Price to Book Ratio.
While Graham preferred defensive investors to look for companies having a PE Ratio of less than 20 and a P/B ratio of less than 1.5, the P/B component is often too restrictive. The multiplier he used as 22.5 multiple of PE and P/BV.
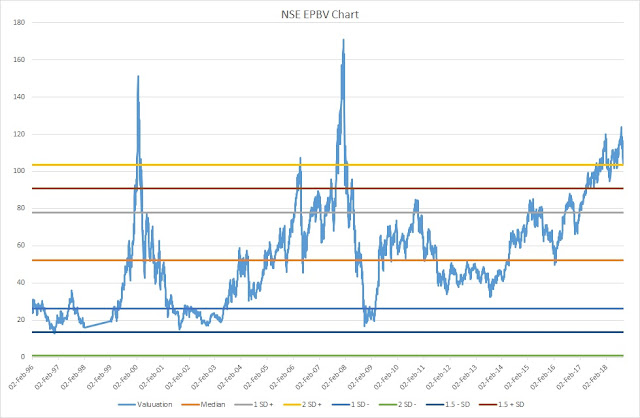
I have taken his logic and draw the same on NSE 500 Indices (represent 93% of list market capitalization.)
 |
| NSE 500 PExPBV chart |
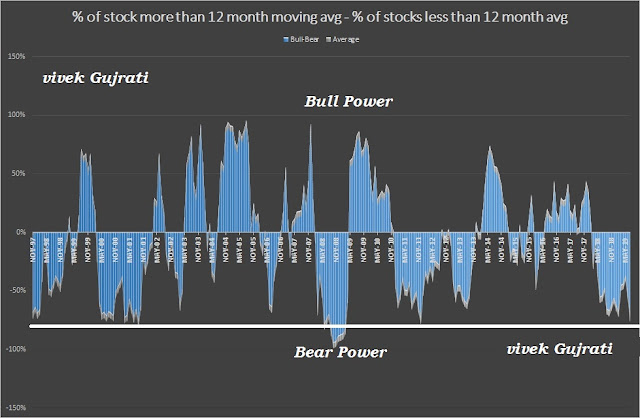
Generally, it is considered that bubble is formed when the asset prices crosses 2 SD. So graham multiplier median is around 52 for Indian market and 2 SD is 103 and historically whenever, it has touched the 2 SD, there has been decent correction. It has crossed 2 SD four times in past 22 years. All 3 occasion, it has corrected and minimum correction was 31% ( May 2006 - June 2006). We have again reached to 2 SD level in December 2017 and hovering there only for sometime. However, BSE small and mid cap is in correction mode since Jan 2018 and corrected around 25%and 15% respectively. This indicate that overall market breadth has been negative since Jan 2018.
I have plotted the NSE 500 PE, P/BV and dividend yield as well. Dividend yield chart work like technical top and bottom.
 |
| NSE 500 Dividend Yield Chart |
 |
| NSE 500 PE Chart |
 |
| NSE 500 P/BV chart |
All these charts are self explanatory and provide lot of information if one read carefully, WE know golden word that this time is different but market is supreme.
Further, I have prepared a relative indices chart. This chart is providing lot of information in respect of market optimism and pessimism. When euphoria or optimism is there in the market, there will be participation from everybody and focus shifted towards small and micro cap vis a a vis large cap to make quick money while during pessimism time people dump the small and micro and move towards safety and focus again shift towards large cap. This is common human psychology for greed and fear and reflect in this chart as well. Ratios are calculated based on nifty vis a vis other indices.
Small cap and mid cap reached to historical bubble zone in Jan 2018 and reverse from that level. Currently hovering near median level but margin of safety is missing and in previous two crisis, it has reached to 1.05x to 1.1 x of nifty ....I really dont know how the future will unfold but current level is not offering enough margin of safety for small and midcap investors. I think this ratio can be used for MF investment as well to shuffle between small cap / mid cap or large cap.
 |
| BSE Small cap and MID Cap vs Nifty indices comparison |
I dont know whether market will correct further from hereon but above indicators help me to do asset allocation between equity and debt. Greed has no end so one has to be cautious and careful in the market.
Disclaimer: I am not SEBI registered analyst. All thoughts and views are mine and I am using it for my asset allocation decision. I am putting it here so as to have record and use it as and when require. It should not be considered for buy or sell decision. it is part of my analysis and study so shared in my blog. Please do your diligence before investing. The above theory can go wrong so I will not be responsible for any loss or profit occur to anybody following my theory.......

Very well explained !
ReplyDeleteGood article. Investment discipline is must.
ReplyDeletePlease give regularly your thoughts so that we can learn from that.
ReplyDelete